
You imagine what’s possible when you give to CU.

2023 fiscal year financial report
Your generosity is an investment in the University of Colorado and in our society’s future.
Thank you for your passion for CU and your vision for what’s important to you.

Here’s how donors like you helped us imagine greater possibilities in 2023.

$435.6 million
That’s how much donors gave collectively in fiscal year 2023 to improve lives across our four campuses, in Colorado and beyond.
66,894 gifts
Your philanthropic partnership with CU ensures we continue to be a strategic solution in our world: Students attend and stay in college and then graduate to find meaningful careers and contribute to their communities. Researchers make astonishing breakthroughs that lift humanity. Creative minds stir our spirits through inventive arts and culture. And health care professionals advance tomorrow’s life-changing discoveries.
Last year, you gave in these areas:
$52 million
to support student scholarships and fellowships
$144 million
to catalyze research and discovery
$35 million
to attract and retain the brightest faculty
$245 million
to transform health, health care and lifesaving efforts
Every gift matters. Here’s who gave last year.
Last year, more than 94% of gifts were less than $2,500.
$6,512
That was the average gift size last year. Gifts are large and small, and each one has an impact on someone’s life.
45,909 donors
Support for CU’s campuses comes from all areas of our communities, state and world.

Who are our donors?
Last year, we were grateful to receive support from:
16,106 alumni
9,420 friends
2,964 parents
2,052 corporations and foundations
953 faculty and staff
You imagine a bright future with your investments in CU.
You give to create a better tomorrow. Gifts that establish and support endowments are investments in that future because they produce reliable funding for decades to come. CU’s collective endowment comprises thousands of individual endowments that, like current gifts, are directed toward a specific purpose directed by the donor. They include scholarships, faculty chairs, new programs and more.
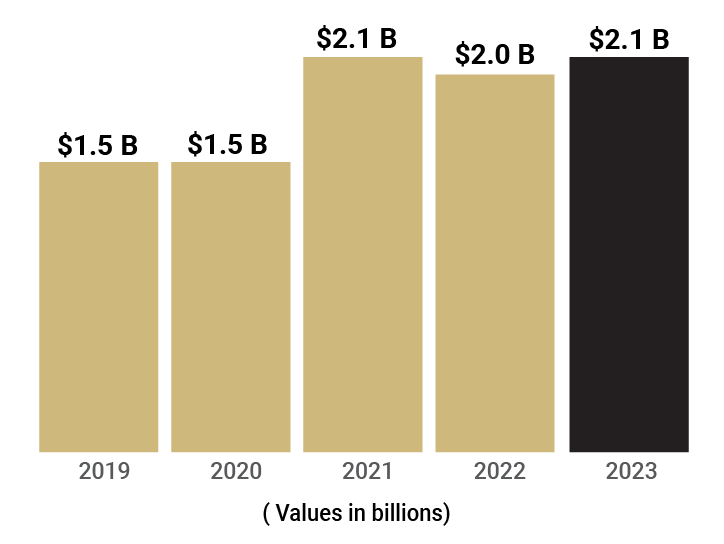
$2.1 billion endowment value
CU’s endowment was valued at $2.1 billion to end fiscal year 2023. Here are the endowment’s values in recent years. (Values are in billions as of June 30 each year.)
3,443 total endowments benefit CU.
145 new endowments were created by donors last year.
$62 million was given to endowments last year.

How the endowment is invested
The endowment is invested in the Long Term Investment Pool, or LTIP, which is broadly diversified across asset classes with a long-term horizon in mind. Here’s how the LTIP was invested in fiscal year 2023.
CU investments vs. policy benchmark
Here is the LTIP’s return compared to its policy benchmark. In fiscal year 2023, the LTIP returned a gain of 7.81% (net of fees) compared to a gain of 12.97% for our policy benchmark.

The Policy Benchmark, effective FY 2018, is a blend of 80% MSCI ACWI (equities) and 20% Barclays US Aggregate Bond Index (fixed income). Depending on the return period presented, historical benchmarks of 40% Russell 3000, 40% MSCI EAFE and 20% Barclays US Agg (FY 2009 – 2017) and 50% Russell 3000, 30% Barclays US Agg and 20% MSCI EAFE (fund inception – FY 2008) are components of the policy benchmark as applicable.

$256 million
Total transferred to CU from the CU Foundation
Audited financials
Find out more about philanthropic investments in CU by downloading our audited financials for fiscal year 2023.